


It's been an exciting process to maintain and continue building Watchdog. I've spent almost two weeks improving the stability of the application, implementing new features, and fixing strange bugs. I've learned so much about Python and applications that focus on Extract, Transform, Load.
🔨 Stability
One of the biggest thorns in this project is stability. As the code base grew sometimes updates wouldn't go as smooth as intended. I'd have two or three crashes in a single day that would terminate Elise, formerly get-calls. As a result I would lose these real-time alerts. Usually it could be resolved with a restart but the culprit was usually one of the three:
- The RPD web server timed out responding to my request
- The connection got denied because the RPD web server was down
- The location data was in an unexpected format and I had to build a new edge case
Culprits one and two were a little difficult to identify at first but implementing the ability to log stack traces was incredibly helpful to identify the cause of the crashes:
import traceback
try:
   # something that could fail
except Exception as err:
   e = traceback.format_exc()
   log_error(error=err,send_SMS=False,msg=e)
As far as location data, I knew that I was going to get strange locations from time to time that I'd have difficulty parsing whether it was within my vicinity. So I captured the location that triggered the failure and built out edge cases to handle them.
📃Tests
As this was one of my first complex Python programs I was bound to make several mistakes and mistakes were had. After several failed deployments and strange bugs I found my edge cases to test for and built out unit tests. I also reorganized the structure of the application. Some of the early deployments did not go smoothly and there have been several deployments in the last month that almost took an hour to complete.
Unit Testing became vital when implementing the static map images into the application because I ran into several issues with generating the correct map image for geo-coded locations. After developing tests I was able to resolve the issue: accidentally appending "Richmond, Virginia" to coordinate based image requests. This lead every specific set of geo-codes to actually resolve to the center of Richmond, Virginia instead of the intended target.
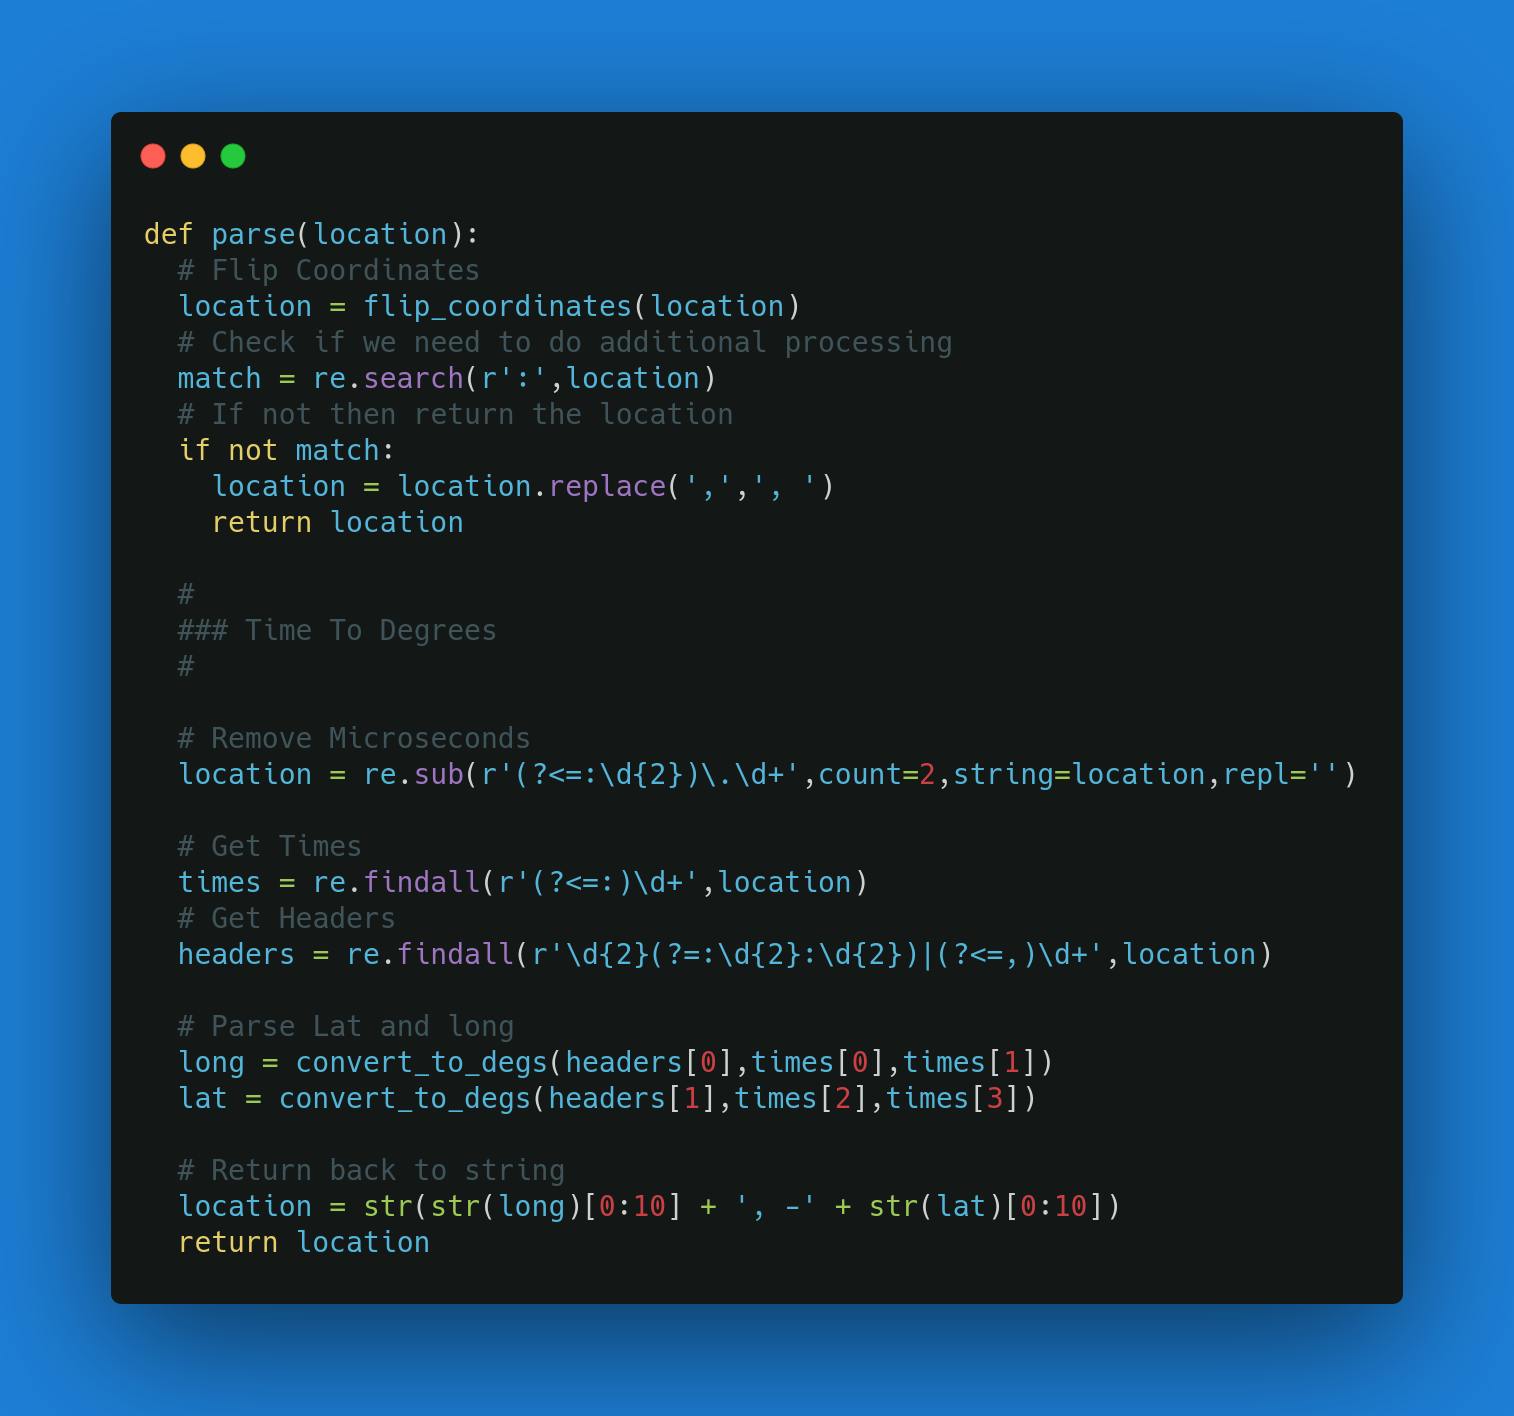
As seen above I had to work some additional Regex magic to parse these geolocations. Over the course of building this project I've grown more comfortable with Regex. I've unlocked the knowledge of Positive and Negative Lookaheads.
📈 Automatic Up-Time Tracker
I ended up writing a little shell script that runs in a cronjob to check for the up-time of Elise; however, I think in the future I am going to work towards moving this to Splunk. Which leads me to my next topic:
📟 Monitoring
For the last three years I've used Splunk on a daily basis at my job. I've grown quite fond of it and am familiar with how it works. So I figured it would be a good idea to start logging more data into some sort of monitoring tool. Especially since I don't have as much time to build my own monitoring tools (yet).
Splunk allows me to easily pipe my data through several functions to quickly draw statistics about what is happening. I use it to track things like the breakdown of call types, the breakdown of map image failures and successes, which map locations cannot be downloaded, # of calls added, and etc. In fact I use this little shell script + a cronjob to keep track of the temperature of the Raspberry Pi:
A temperature tracker for the Raspberry Pi w/ automatic fail-over to write to a CSV if a connection to Splunk cannot be established.
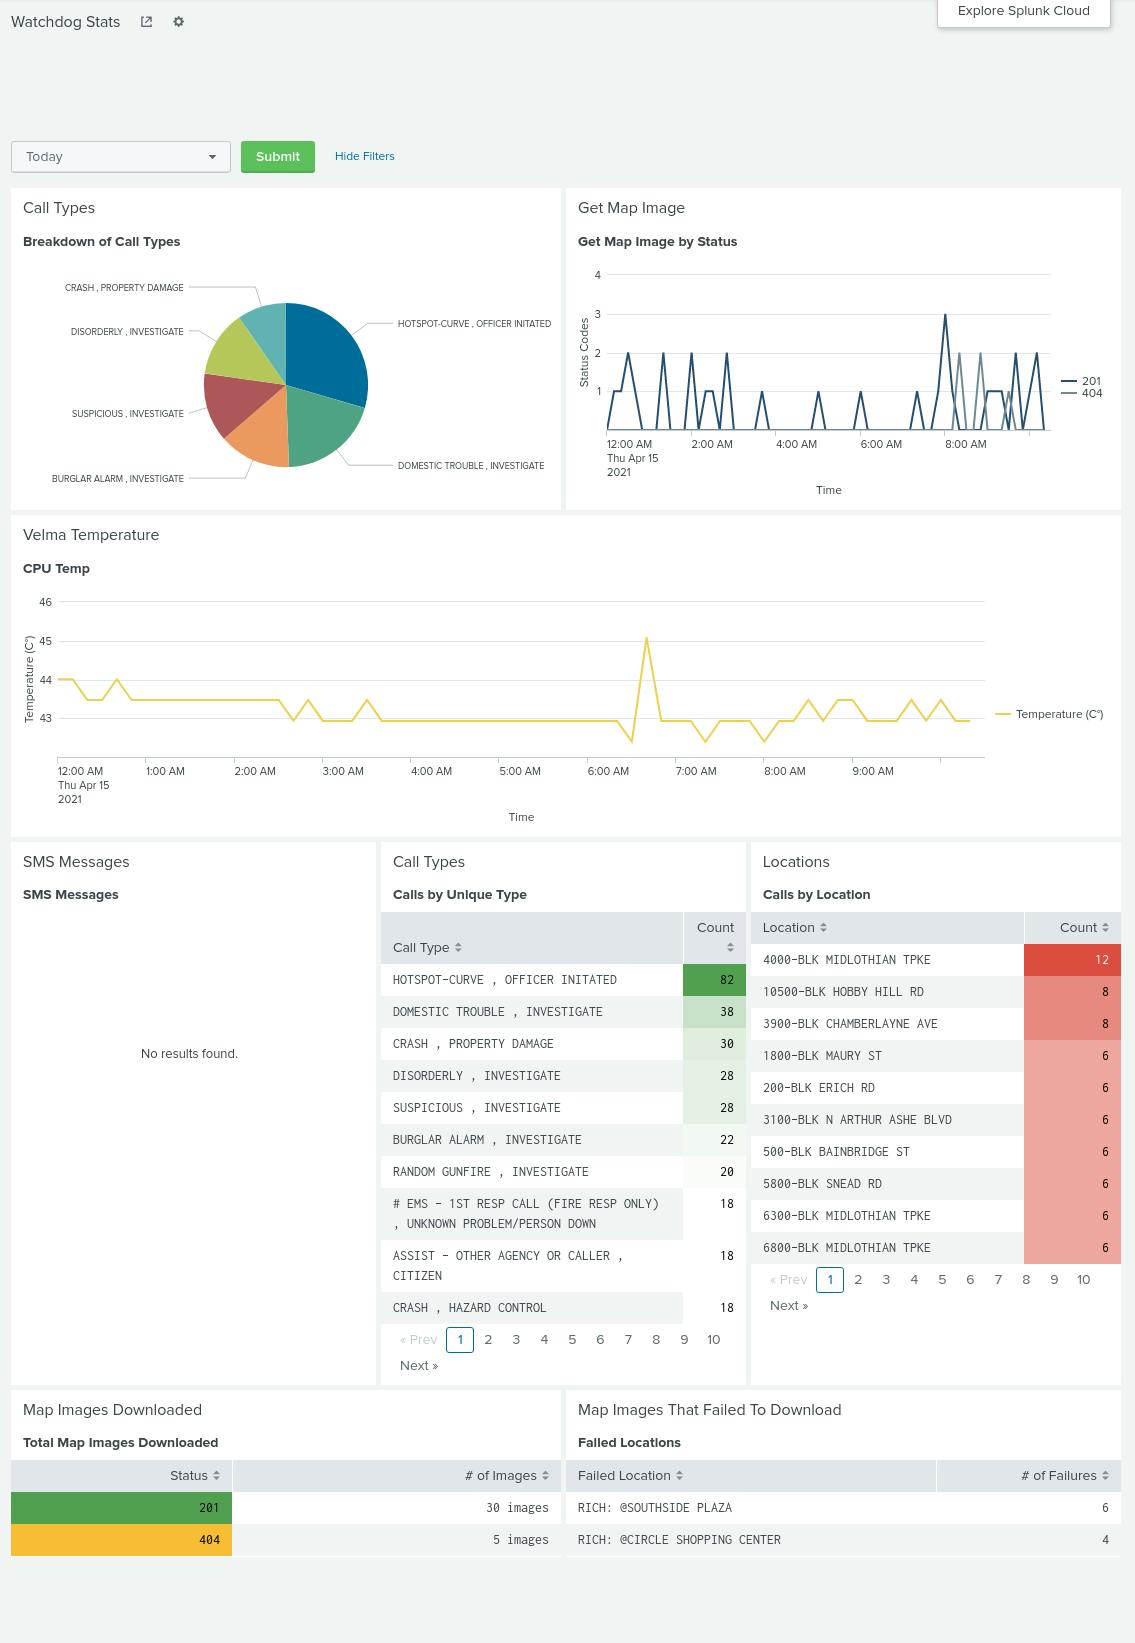
Being able to quickly gauge the status of my application has been critical during the rewrite of the web app. The process was quite simple, I setup an HTTP Endpoint, prepare some JSON, send it off and lo and behold I have a nifty little dashboard that let's me check in on the status of my application:
"Make each program do one thing well. To do a new job, build afresh rather than complicate old programs by adding new features… Expect the output of every program to become the input to another, as yet unknown, program." - Doug McIlroy, creator of Unix pipelines
Data Migrations
Over the last month I've had to refactor some of the ways I store and collect data to improve the application's performance and accessibility. I've used Python time and time again to write these migrations because I can quickly throw something together to process 10,000-12,000 rows of data.
🕒 Time to Migrate
Each record in the database is recorded as an event. It contains several parameters but as I began combing through nearly 50,000 records of data I realized there was a piece of data that was missing: the updated time of an event. I assumed, incorrectly, that the Time Received field would update on each event like if a unit were to change their status from Dispatched -> Enroute or another unit was to be called. This was not the case. So I added a new field: Time Inserted. Which simply takes the time inserted into the DB.
Events -> Incidents
I also realized I was going to need to perform some grouping with these events. Since multiple units could have multiple statuses over the course of an incident that would lead to multiple events. So I grouped these incidents together based off of call type, location, & time received. This allows me add some additional features to the web.
📍Map Images
I wanted to be able to include map images into the web app and eventually into the text alerts. In order to do this I needed to parse the locations between several different categories. The images are downloaded onto the web server to cache requests.
The Website
I added maps then immediately broke the service trying to optimize the maps and the view. I've renamed the micro-service Annie. It has two parts: API & Svelte Frontend.
🖌️ UX
There is a lot of text and well... it's just not very pleasant to look at. - Graphic designer confidant
My UX skills need some work. CSS has always been a weak point and I want to spend additional time to step away from utilitarian libraries like TailwindCSS and learn what the heck the box model is anyways. As well as, how to make something look good and play nice with different devices. And if you don't trust me look for yourself:
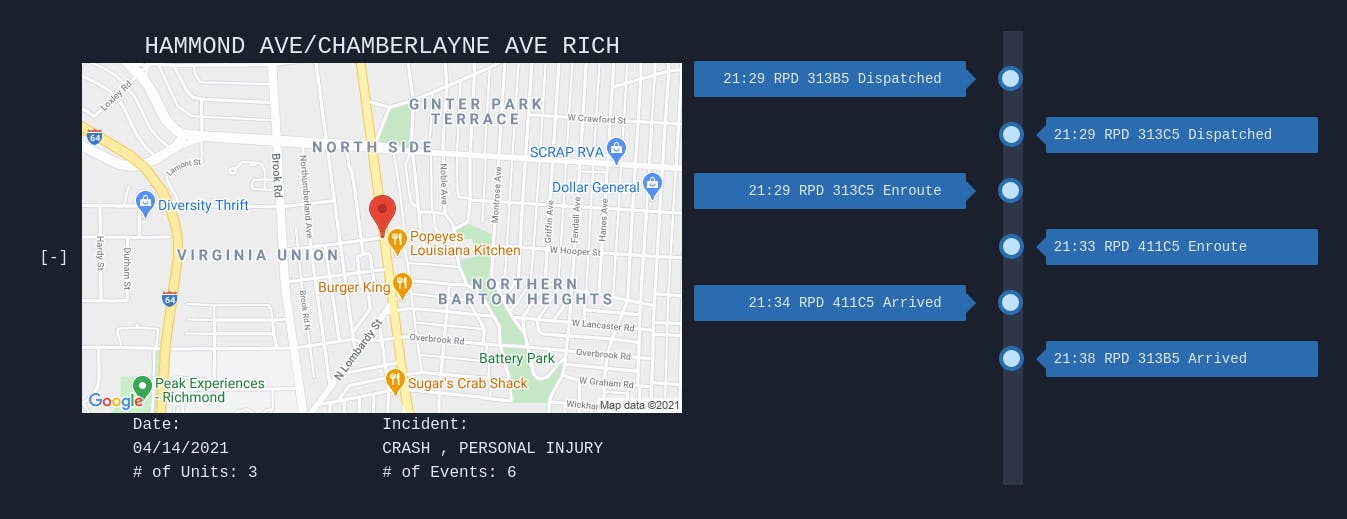 I love this timeline idea but I need to revamp everything else about the design.
Using Svelte
I love continuing to use Svelte to power the front end experience. I am looking forward to transitioning to SvelteKit to simplify the web development experience.
What's Next? 🧪
- I want to find a way to send the application up/down time to Splunk.
- Add Geocodes to all stored locations and implement a spatial plugin for the database
- Migrate the Frontend to SvelteKit
- Add a Marker to nearby alerts that shows both the home and the event
- Add Icons to the marker for the different call types